2. Show the pro forma PROFIT & LOSS screen
Immediately. See the outcome! A pro forma (projected) P&L for the year.
Even with very few inputs (from the Inputs screen), this projected P&L has a lot of information on it.
- First, it projects 12 monthly P&Ls: revenue, expenses, and profit by month.
- Then, the totals of each revenue or expense category for the year
- And, it shows each of those annual totals - revenue, expenses, profit - as a percent of total revenue.
You: “The pro forma (projected) P&L shows total sales for the year: $1,050,000. After expenses, that leaves only $25,500 in profit — about 2.4% of sales.
“But let’s not stop there. Let’s also take a look at the Cash Flow screen."
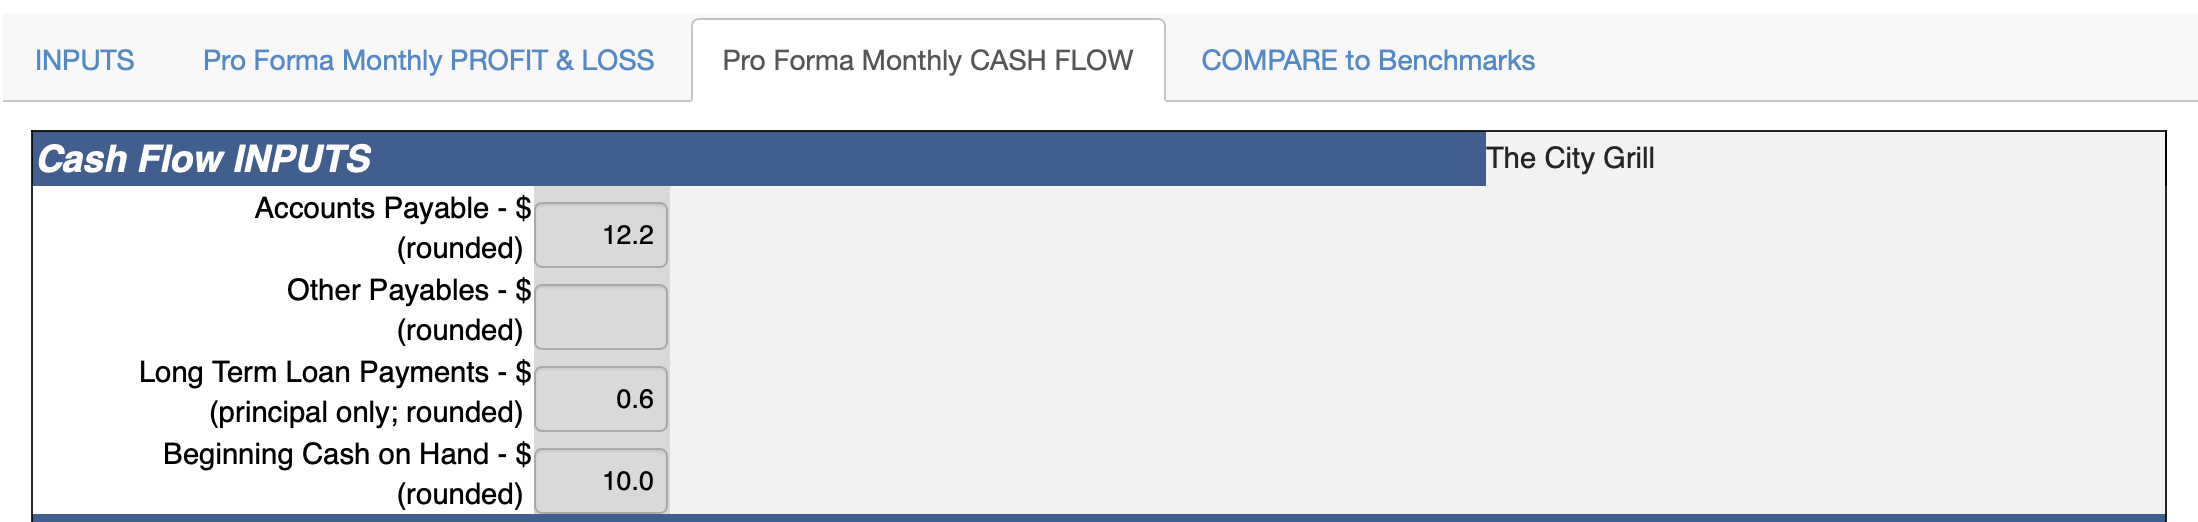
“First, there are a couple more inputs required; we will enter those.
"Now, let’s scroll to the bottom of the screen, past the three major parts of a Cash Flow: Cash Coming In, Cash Going Out, and The Difference. Look at that line at the bottom, the Ending Cash Balance each month.
“See how, even with a profit for the year, the Ending Cash Balance for your plan runs negative for the first eight months, before it finally turns positive?”
Owner 1: “Yeah, those first months are brutal.”
Owner 2: “We always feel the squeeze in winter.”
Step 1: Highlight where the strain comes from
You: “Exactly. We can see that better because of the expense 'buckets.' Notice January, February, March — sales are soft, but your fixed costs, like occupancy, admin and owner pay, are the same every month. That mismatch is what creates the long cash shortfall.”
“So it’s not that your sales plan is ‘wrong.’ It’s just that the seasonality puts you underwater until late summer.”
“Strata:G is especially useful because it lets us play 'What if…?' We can see in advance the outcome of strategies we could try, and then choose: which ones pencil out.”
�
Step 2: Explore “What if…?” scenarios
You: “Let’s see what happens if we tweak the sales pattern a little.”
Boost weak months?
You: “What if January and February food sales came in a little stronger? Maybe from a promotion, catering, or special events. What difference would that make?”
Adds 10% to Food sales in January and February (easy calculation); then shows Cash Flow screen.
Owner 1: “Hmm, look at that. That could make us cash flow positive two months sooner.”
Shift toward beverages?
You: “Now, what if your sales mix tilted a bit more toward beverages — say 20% instead of 15%? Let’s test it.”
Adjusts mix by moving $5,000 each month from Food revenue to Beverage revenue. Strata:G immediately recalculates.
“See how gross margin dollars rise, even though total sales stayed the same? And look at the cash flow — the recovery comes earlier.”
Owner 2: “So just more bar sales, not necessarily more sales overall?”
You: “Exactly — that’s the power of the higher margin.”
Strengthen peak months?
Owner 1: “What if July, August and September sales were each a little higher? I’ve always heard it’s better to make a good month better.”
(Adjust sales of both food and beverage in July, August and September; look at Cash Flow screen)
You: “That surge in peak season carries forward — you end the year stronger, with more cushion.”
Owner 1: “That feels doable. That's one of the times when we’re busiest anyway.”
Step 3: Turn it back to them
You: “So here’s the pattern the numbers are showing:
- Small lifts in the slow months shorten the cash drought.
- More beverage sales improve margins without more volume.
- Stronger peak months give you more year-end cushion.
You: “Now, you know your business — which of these feels most realistic? Brunch? Late-night bar traffic? Catering? Seasonal promotions?”
Owner 2: “We’ve talked about adding Sunday brunch in January and February…that could help the slow months. And boost beverage sales too – Mimosas and Bloody Marys!”
Owner 1: “And we probably could push more bar specials in summer.”
You: “Great — those are exactly the kinds of things this model is meant to test. You tell me the idea, we’ll run it through here, and you’ll see the P&L and cash flow impact right away.”
Step 4: Wrap with clarity
You: “Here are the takeaways:
“As it stands, your plan has you scraping by on 2.4% profit and running negative cash for most of the year.
“But the good news is, even modest changes in specific months or in your sales mix make a big difference."
“Think of this tool as your dashboard: anytime you’re considering a new idea — whether brunch, later hours, or catering — we can plug it in here and see instantly how it affects profit and cash.”
Owner 1: “Feels like we finally have a way to test ideas before we spend money on them.”
You: “Exactly. It’s your business strategy lab. Now, what time next month shall we get together to review progress?”