STRATA:G® Advisory Solutions
A Difference-Maker For Accountants, Bookkeepers, Trusted Advisors

Retailers 3-in-1 Integrated Calculator

Now available for retail businesses: Financial Modeling Power

Integrating...the P&L plus the inventory mix into a monthly cash flow. In real time. 

Has it ever been accurately done before? Not to our knowledge.

Nowhere else can retailers so clearly see and experience the cause-effect levers in their business. Powerful!

Inputs are easy – and few. 

 
Results are immediate – One, Two, Three – and often eye-opening! 
 

>>> It's easy to get started – the Profit Plan


ℹ️ more info on The ROI site

#1. Profit & Loss

Just a few entries of numbers retailers readily have available – planned sales, margins, and expenses – immediately produce a (A) monthly P&L; (B) 12-month Totals for each line entry; (C) Percent of Sales each line entry represents.

What-If's Are Easy
Make as many tweaks as your retailer wants to, and see immediate effects, to get a profit plan that they believe in.


>>> Next – the inventory buying plan for that sales plan.


ℹ️ more info on The ROI site

#2. Inventory

Only two additional entries are needed for the inventory buying plan – Beginning Inventory @Cost, Planned Inventory Turns.  All other needed numbers have been brought over.

Immediately, a monthly buying plan is generated – a "Wow!" for retailers! – showing (A) net Open-to-Buy for each month; (B) targeted Ending Inventory for each month; (C) projected GMROI.

 Inventory Buying Plan from 3-in-1 Calculator

What-If's Are Easy
Make an adjustment to the turn rate by changing the dial.

Immediately see the effect on

  • Ending Inventory levels

  • GMROI

  • Monthly buying budgets

Another "Wow!"

>>> Wait! There's more! IMMEDIATELY see the Cash Flow implications. 


ℹ️ more info on The ROI site

#3. Cash Flow

To our knowledge, nowhere else are there pro forma calculators or software that accurately merge the components of retail inventory management (fluctuating margins, inventory turns, and seasonal sales) into an accurate cash flow.

Only the Retailer's 3-in-1 Integrated Calculator can do this. 

Add four more entries – Inventory Payables; Other Payables; Long-Term Loan Payments (principal only); Beginning Cash on Hand. 

Immediately, a fully integrated monthly retail cash flow is generated. Remarkable!


What-If's Are Easy
The Ending Cash Balance each month can be an eye-opener for a retailer. And inspire more tweaks to the plan.

Any of the inputs can be adjusted:

  • Each month's sales;
  • Each month's Gross Margin;
  • Each expense "bucket";
  • Inventory turnover rate. 

Each tweak of the P&L or the Inventory plan is instantly reflected on its own screen, and in the cash flow, leading to more "Aha!" And even more "What would happen if I...?" 

What an opportunity to expand and deepen your business consulting connection with your retail clients. Enabling them to see the financial implications of their choices is very empowering.

>>> And, immediate perspective – ratios for this plan, built-in Benchmarks for all verticals.

And, Compare to Benchmarks

The 3-in-1 Calculator produces the key retail ratios for each plan entered.  Benchmarks of those ratios are built-in for each retail vertical, making quick work of gaining perspective.


Strata:G for Retail Operations

The Strata:G sophisticated financial modeling tools – disarmingly low-key and approachable - focus on each industry’s key financial levers, the key “manageable variables” that matter to business owners. The Strata:G Toolkit for Retail Operations includes:

Reference Key Ratios Benchmarks – 41 separate verticals
Show owners the Key Financial Ratios benchmarks for the median-performing businesses in their NAICS industry vertical. A great Conversation Starter.
 
STRATA:G® Key Ratios Calculator for Retailers
“What are my ratios? And how do they compare?”
With inputs from the client’s financial statement, the Strata:G Key Ratios Calculator immediately shows the client the Key Financial Ratios for their business, and compares them to the built-in industry benchmarks for their NAICS vertical.
 
STRATA:G® 3-in-1 Integrated Cash Flow Calculator 
Built for projecting, not accounting.
With only a few inputs, Strata:G immediately projects pro forma monthly P&L, plus the Inventory Buying (Open-to-Buy) plan, plus the integrated Cash Flow. 
 
Don't like that outcome? Use Strata:G's "What if...?" powers! Change an input; immediately show impact on profits and cash. Make another change; show those results. In real time!

Every one of these "tools of engagement" has been designed to be used with a retailer, whether in person or via video conference. They are for projecting, for comparing "what if...?" choices. 

These tools quickly provide the key insights – the "Ahas!" – that underlie strategic business decisions.

More than anything, these are for relationship building with your retail clients. Each one enables you to "show, not tell." Powerful!

Whatever your retail clients' questions or issues, now you can sit with them and explore the possibilities.

  • Compare and contrast the financial implications, in a retail context, in real time.
  • Learn from their questions and concerns.
  • Discover their appetite for risk, their vision for the future.
  • Enable them to make informed business decisions (and maybe even to develop a new-found appreciation for "the numbers!")


Expense Analysis – "The Bucketizer"

From an all-too-typical P&L of alphabetized line item detail, the "Bucketizer" enables sorting the data into categories of expenses: one variable expense category, four fixed-expense "buckets:" 

  • Selling Expenses
  • Occupancy Expenses
  • Administrative Expenses
  • Depreciation, Amortization
  • Taxes

Just like that, all that data becomes useful management information. And these are the five categories of expenses needed for use with the Retail STRATA:G Consulting Calculators. 

That makes it easier for retailers to monitor expenses; make comparisons to prior years; quickly identify which expenses are increasing; focus on key drivers of profitability for their operations.


ℹ️ more info on The ROI site

pro forma Retail P&L Forecaster

Inputs go in quickly: 

(A) Set starting month of 12-month planning period; (B) Enter planned sales and gross margins by month; (C) Enter expenses via one entry for each of 5 buckets (categories)


Immediately – pro forma P&L: (A) Month by month results; (B) Totals for the 12-month planning period; (C) Percent of Sales of each total

Plus, Year-To-Date totals for each month, making it easier to monitor actuals-versus-plan in regular follow-up meetings with retail clients. 

What-If's Are Easy
Adjust any of the expense "bucket" inputs; retailers instantly see the effect on their bottom line.

Suddenly their P&L has become a useful tool for looking ahead, comparing choices, not just a historical reference. 


ℹ️ more info on The ROI site

Inventory Buying Plan Forecaster

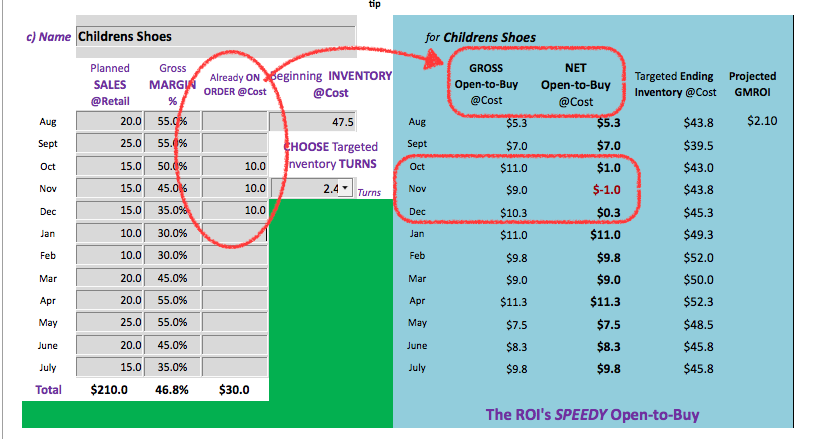
The Retail STRATA:G® "Open-to-Buy" calculators ingeniously use the targeted inventory turnover rate to drive the buying budget, thereby reflecting the seasonality of planned sales. It's like having cruise control for inventory management!

Using numbers retailers can readily supply – monthly sales and margins, plus inventory turnover rate – immediately generate (A) maximum inventory receipts by month; (B) targeted Ending Inventory levels each month; (C) the resulting GMROI; (D) built-in comparisons to Key Performance Ratios of retailers in their vertical.

This is a "Wow!" for a retailer. Every time! Especially when they can see – instantaneously! – the impact of changes in the turn rate on the buying plan, and the targeted inventory on hand.  


ℹ️ more info on The ROI site

Multi-Department Inventory Buying (Open-to-Buy) Planner

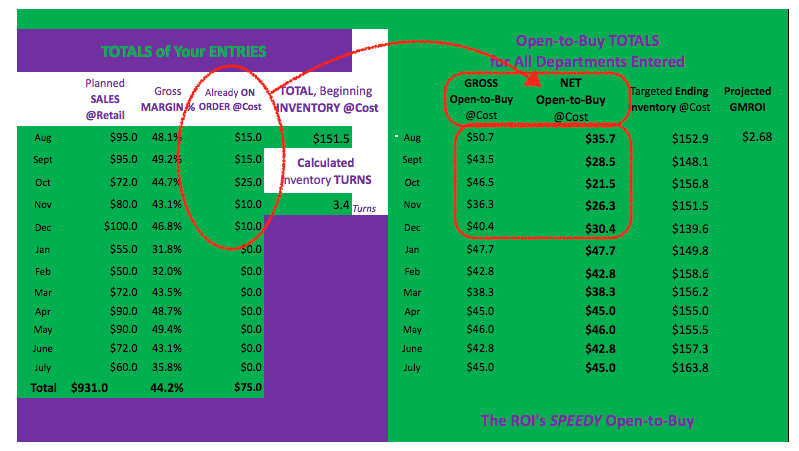
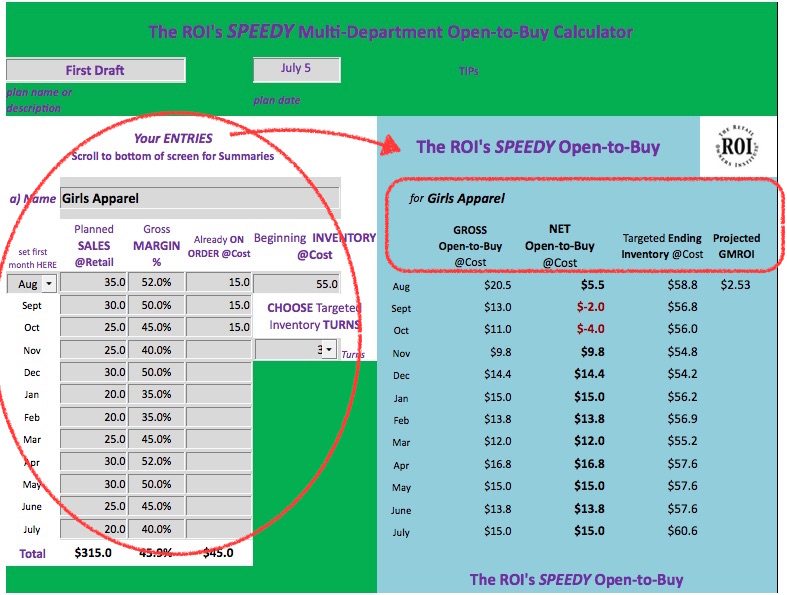
The Multi-Department Inventory Buying Calculator enables inventory buying plans for up to seven departments at one time, each with its own monthly sales seasonality, gross margins, beginning inventory, and turnover rates. 

Once again, all that's needed for the inputs are the numbers retailers readily know. 

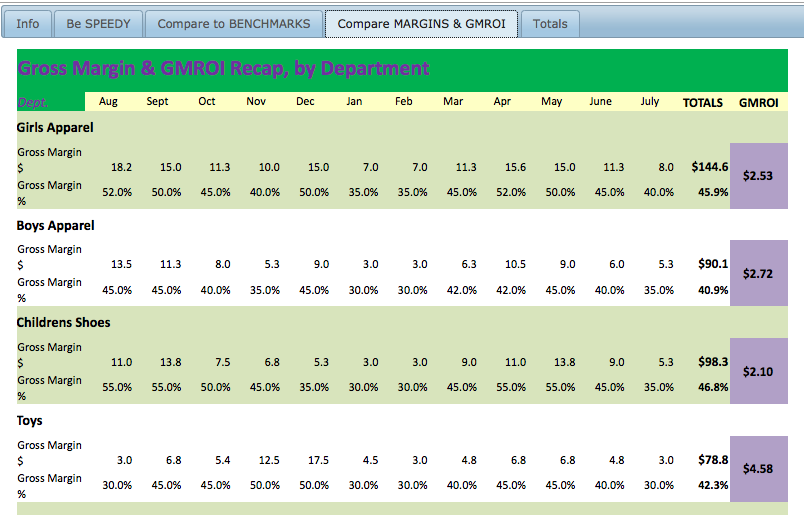
In addition to a buying plan for each department entered, the Multi-Department OTB Calculator then aggregates all of this into a grand total for the business showing total planned sales, overall Gross Margin, plus the (A) total (maximum) inventory to be brought in each month, (B) each month's total targeted Ending Inventory, (C) total inventory on order for each month, (D) total overall GMROI.

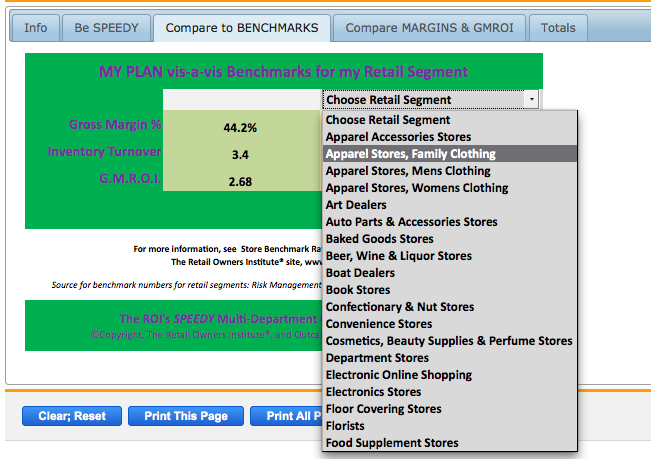
And it includes the (E) built-in comps to other retail verticals. 


ℹ️ more info on The ROI site

Quick Reference KPIs for Retailers

Splendid for "conversation starters."

See Key Financial Benchmarks for more