Strata:G® Case Study – Retail Business
Retail Owner + Business Advisor
Assume you are meeting with the owner of a specialty retail business generating approximately $5 million in annual sales.
The owner is frustrated.
Sales have been flat for several years. Margins are under pressure. Competition has intensified, and customers seem increasingly price-sensitive.
The owner has been wondering whether it is time to change the company's business model.
"We've always tried to protect our margins," he explained. "But maybe that's the wrong approach today. What if we became much more promotional? Could higher sales volume make up for lower margins?"
Rather than debating opinions, you suggest testing the idea using the Strata:G® 3-in-1 Integrated Calculator for Retailers.
[Use these input numbers with the Strata:G 3-in-1 Calculator for Retailers; test or validate "What if...?" ideas.]
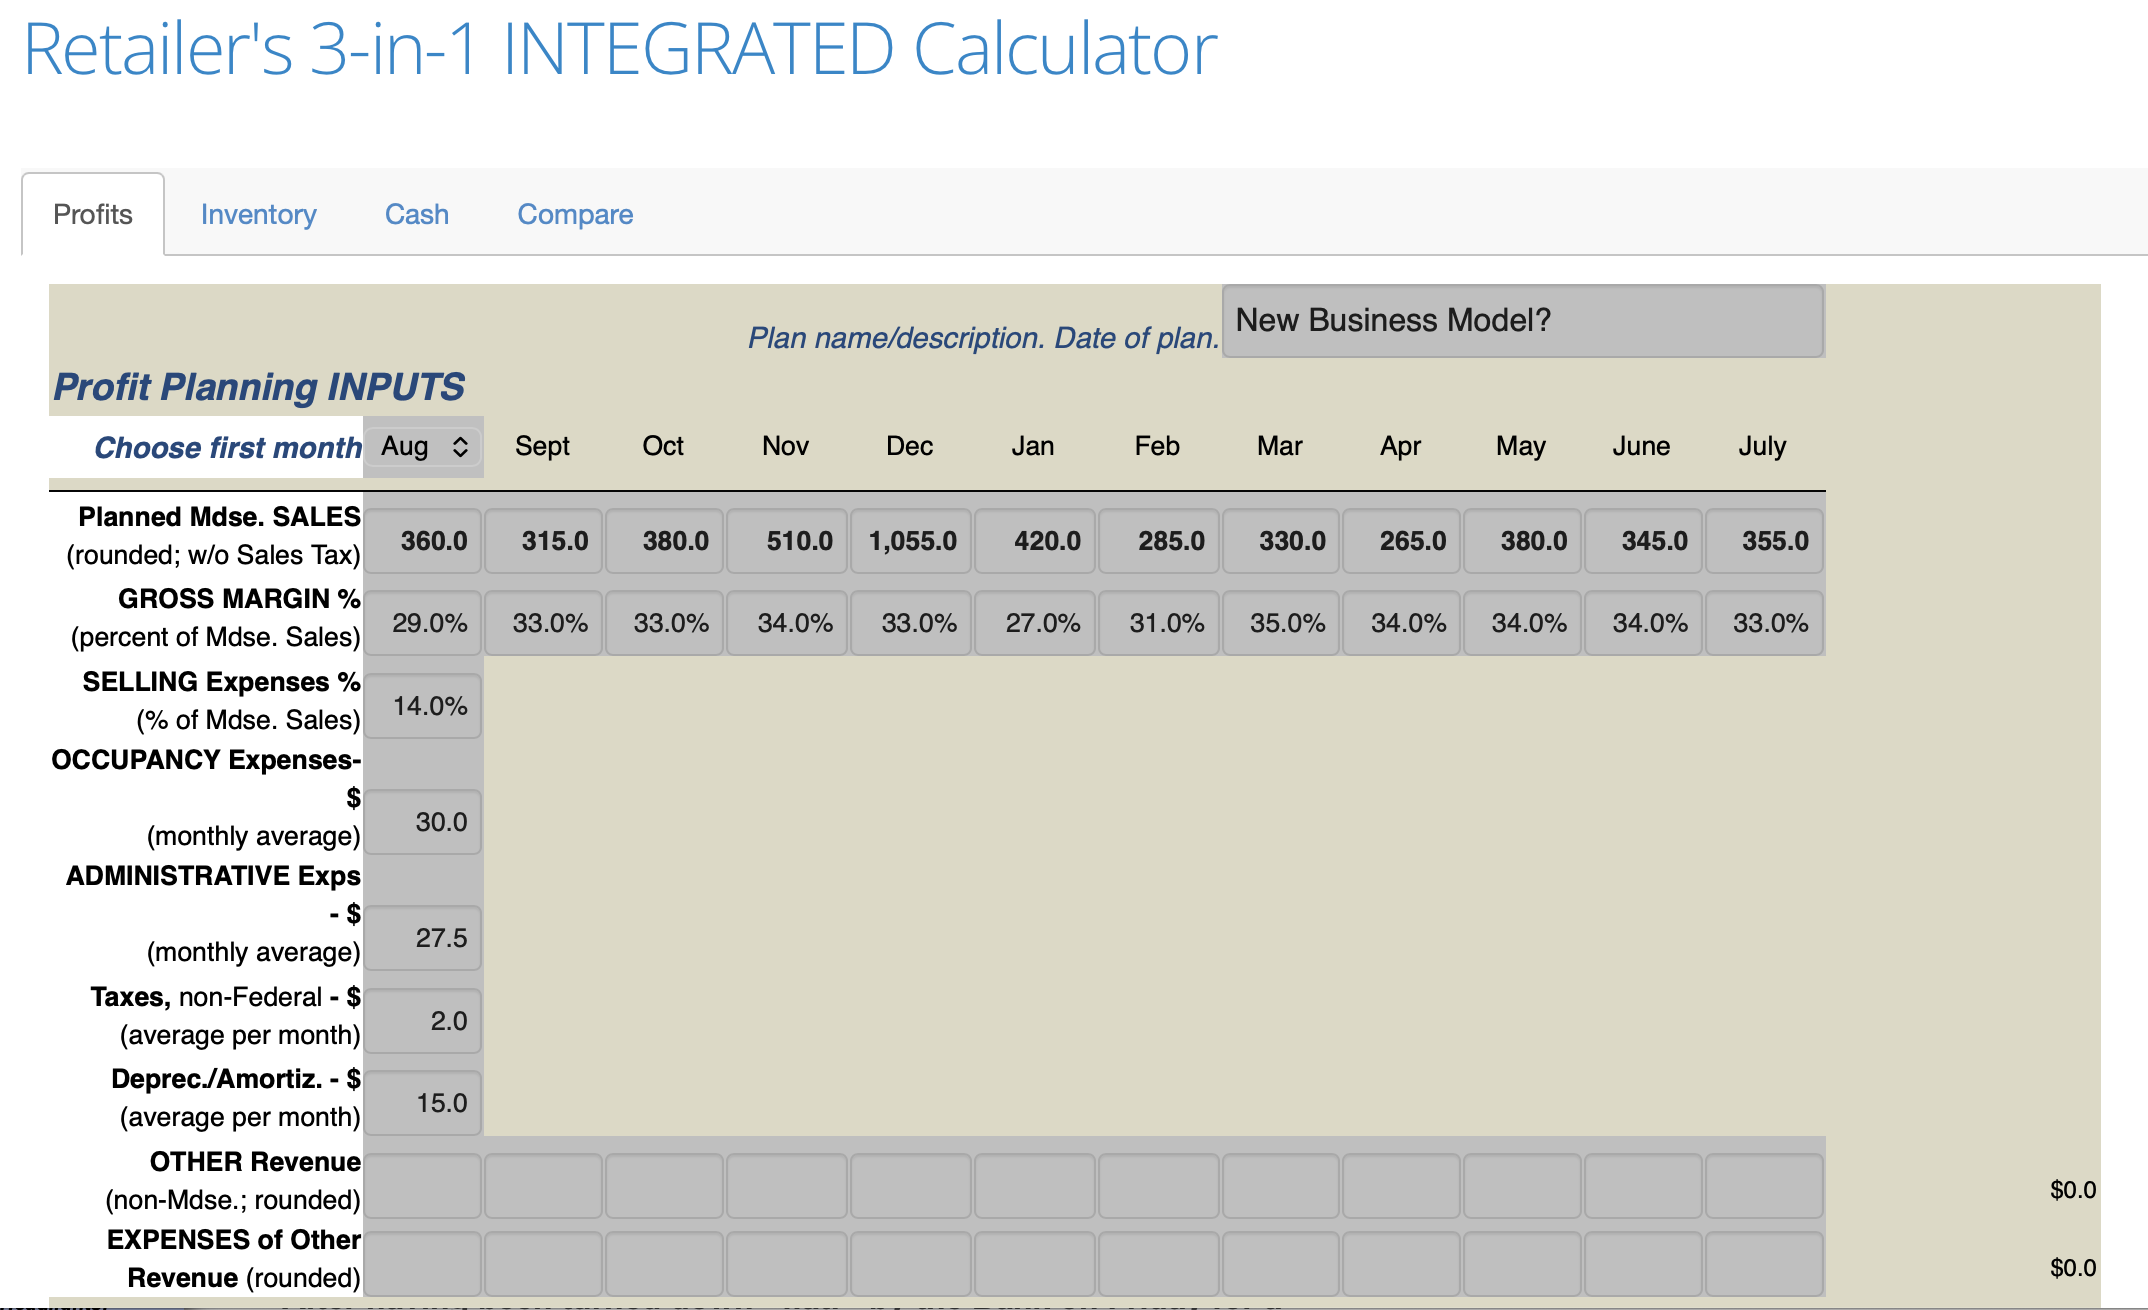
Start at the INPUTS Screen
Using the owner's preliminary plan, you enter projected monthly sales that total to $5 million for the year. Gross margin percents also are entered by month.
Major expenses are entered by "buckets." You explain: "One reason this goes quickly is that expenses have already been grouped into those 'buckets' of major categories. Instead of wrestling with dozens of line items, we can focus on the financial levers that really drive the business."
- Selling expenses are variable expenses that vary with volume, so are entered as a percentage of sales.
- All other expenses are fixed expenses, essentially the same amount each month. The average monthly dollar amounts are entered.
Review the Projected PROFIT & LOSS Screen
The projected P&L appears immediately.
With just those few inputs (from the Inputs screen), this projected P&L has a lot of information on it.
- First, it projects 12 monthly P&Ls: projected revenue, expenses, and profit for each month.
- Then, in the far right column, the totals of each revenue or expense category for the year
- And, it shows each of those annual totals - revenue, expenses, profit - as a percent of total revenue.
The retailer studies the screen. The result? Basically break-even.
"That's about what I expected," he says. "Technically profitable, but not enough to get excited about."
You nod.
"Before we decide whether to change anything, let's see what that means for inventory and cash."
Next, you move to the INVENTORY screen.
Because the 3-in-1 Calculator is integrated, sales and margins automatically flow into the inventory plan.
Only two additional inputs are needed:
- Beginning inventory @cost at the start of the planning period
- Desired inventory turnover rate.
The owner selects six inventory turns, consistent with current performance.
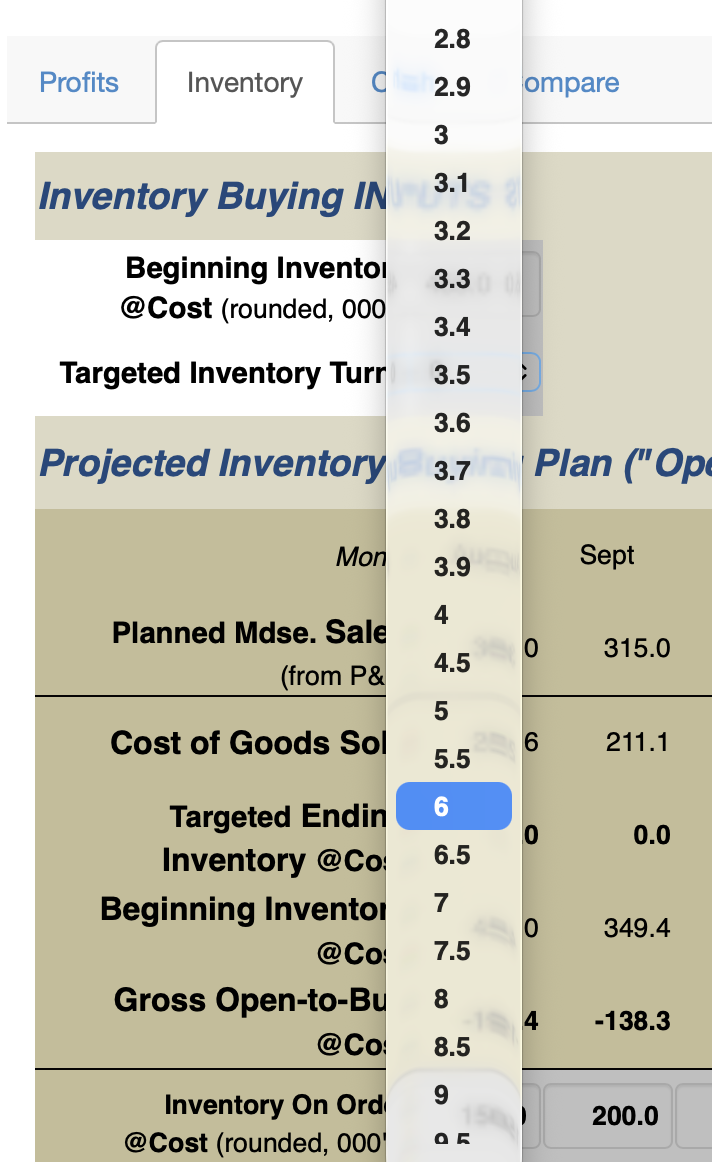
Instantly, Strata:G calculates a month-by-month inventory buying (Open-to-Buy) plan.
"Not only is that fast, it's really useful!" the owner says. "Now I can quickly see the maximum amount of inventory to bring in each month to support the sales plan."
You agree.
"And now let's see whether the inventory plan creates any cash pressure."
Review the CASH FLOW Projection
Moving to the Cash Flow screen, there are a few additional inputs to enter:
- Beginning cash.
- Inventory payables.
- Loan principal payments.
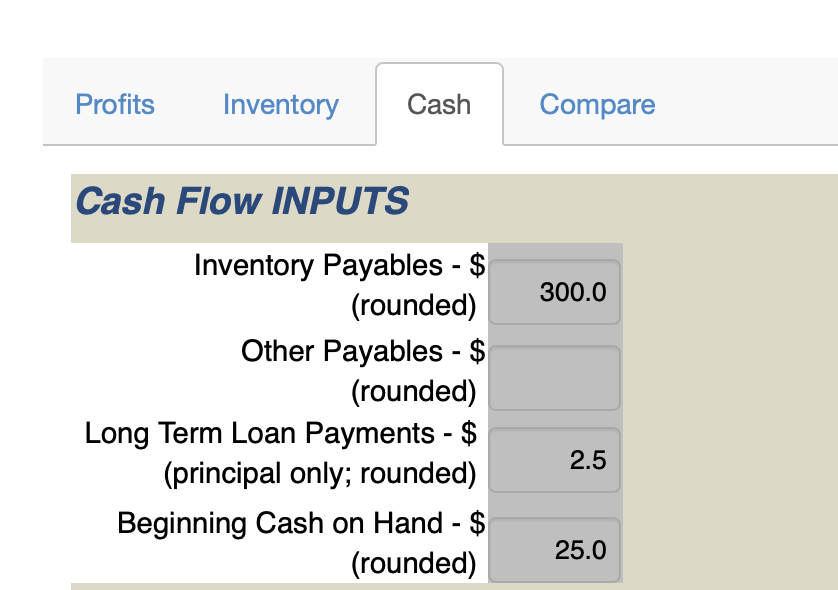
The projected Cash Flow appears immediately.
The owner stares at the screen. The first four consecutive months, cash goes negative.
"That's ugly," he says.
"Exactly," you reply. "Even though the P&L shows a slight profit, the cash flow tells a different story."
The owner quickly spots the problem. "We'd need almost half a million dollars of short-term financing to get through our holiday inventory build."
You nod.
"And with essentially no profit," he continued, "convincing a lender to provide that financing could be difficult."
The room gets quiet.
Then the owner asks the question. "So...what if we really did change the business model?"
"Doing 'business as usual' isn't going to cut it. As we've watched margins come down the last couple of years, we've talked about changing our model, and being much more promotional."
Test a New Strategy: "Does it pencil out?"
The owner decides to test a more promotional approach of lower prices to attract more customers and improve sales.
- Margins are reduced from current levels to (gulp!) approximately 28%.
- To simplify the first draft of the idea, monthly sales are increased by $100,000 per month; fine tuning can happen later.
Strata:G immediately recalculates.
The first result isn't encouraging. Profit turns negative. The owner laughs. "Well, that's not going to work."
You remind him:
"If we're changing the business model, other things would change too."
Together, you test additional assumptions.
- Selling expenses decline from 14% of sales to 12%, reflecting less traditional advertising and more digital marketing.
The revised P&L appears.
The owner leans forward. "Wait a minute. Profit just tripled."
What About Inventory and Cash?
Next, you revisit inventory planning.
- The owner believes a more promotional strategy should increase inventory turns from six to seven, or a 7-1/2 weeks supply.
One easy adjustment to turn rate. The Inventory and Cash Flow screens immediately update.
Now the results become even more interesting.
- The required seasonal borrowing falls from approximately $475,000 to $325,000.
- The financing need arrives one month later, in September instead of August.
- And the loan can still be fully repaid in December.
The owner smiles. "That's $150,000 less borrowing."
"And less risk," you add.
"Looks like bigger IS better!" the owner mused. "Of course, this won't happen by itself. We have to make some pretty big changes. But the customers are demanding it; we have to do something!"
"This way, we have a road map for those changes. And, we have the confidence that, if we do stick to this plan, it will pay off for us. All that change will be worth the hard work by our staff to achieve it."
The Power of "Show, Not Tell"
The discussion started with a difficult question: Should this retailer change its business model?
Nobody knew the answer.
But instead of relying on opinions, assumptions, or gut feelings, the owner was able to test the idea before committing to it.
The integrated Strata:G 3-in-1 Retail Calculator revealed how changes in sales, margins, expenses, inventory turns, and cash flow interact with one another.
The result wasn't simply a better forecast. It was greater confidence. The owner now had a financial road map showing what would need to happen for the strategy to succeed.
That's the power of Business Strata:G.
Not telling owners what to do.
Showing them what would happen if they did it.